NAME
Chart::Plotly::Trace::Parcats - Parallel categories diagram for multidimensional categorical data.
VERSION
version 0.021
SYNOPSIS
use Chart::Plotly;
use Chart::Plotly::Trace::Parcats;
use Chart::Plotly::Plot;

# Example from https://github.com/plotly/plotly.js/blob/7b751009fc9804272316f0bb539ed0386c0858bd/test/image/mocks/parcats_bundled.json

my $trace = Chart::Plotly::Trace::Parcats->new( bundlecolors => 1,
                                                dimensions   => [
                                                           { label  => 'One',
                                                             values => [ (1) x 2, 2, 1, 2, (1) x 2, 2, 1 ]
                                                           },
                                                           { label  => 'Two',
                                                             values => [ 'A', 'B', 'A', 'B', ('C') x 2, 'A', 'B', 'C' ]
                                                           },
                                                           { label  => 'Three',
                                                             values => [ (11) x 9 ]
                                                           }
                                                ],
                                                domain => { x => [ 0.125, 0.625 ],
                                                            y => [ 0.25,  0.75 ]
                                                },
                                                line => { color => [ (0) x 2, (1) x 2, 0, 1, (0) x 3 ] }
);

my $plot = Chart::Plotly::Plot->new( traces => [$trace],
                                     layout => { height => 602,
                                                 margin => { b => 40,
                                                             l => 40,
                                                             r => 40,
                                                             t => 50
                                                 },
                                                 width => 592
                                     }
);

Chart::Plotly::show_plot($plot);
DESCRIPTION
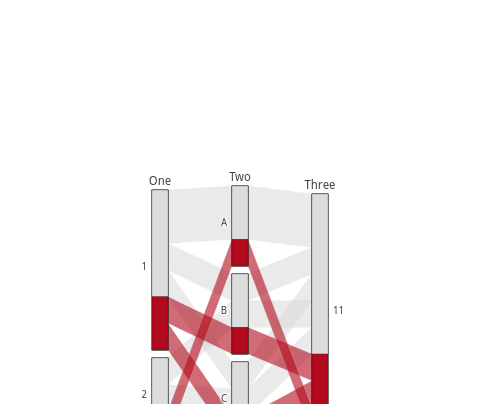
Parallel categories diagram for multidimensional categorical data.
Screenshot of the above example:

This file has been autogenerated from the official plotly.js source.
If you like Plotly, please support them: https://plot.ly/ Open source announcement: https://plot.ly/javascript/open-source-announcement/
Full reference: https://plot.ly/javascript/reference/#parcats
DISCLAIMER
This is an unofficial Plotly Perl module. Currently I'm not affiliated in any way with Plotly. But I think plotly.js is a great library and I want to use it with perl.
METHODS
TO_JSON
Serialize the trace to JSON. This method should be called only by JSON serializer.
type
Trace type.
ATTRIBUTES
arrangement
Sets the drag interaction mode for categories and dimensions. If `perpendicular`, the categories can only move along a line perpendicular to the paths. If `freeform`, the categories can freely move on the plane. If `fixed`, the categories and dimensions are stationary.
bundlecolors
Sort paths so that like colors are bundled together within each category.
counts
The number of observations represented by each state. Defaults to 1 so that each state represents one observation
countssrc
Sets the source reference on plot.ly for counts .
dimensions
domain
hoverinfo
Determines which trace information appear on hover. If `none` or `skip` are set, no information is displayed upon hovering. But, if `none` is set, click and hover events are still fired.
hoveron
Sets the hover interaction mode for the parcats diagram. If `category`, hover interaction take place per category. If `color`, hover interactions take place per color per category. If `dimension`, hover interactions take place across all categories per dimension.
labelfont
line
name
Sets the trace name. The trace name appear as the legend item and on hover.
sortpaths
Sets the path sorting algorithm. If `forward`, sort paths based on dimension categories from left to right. If `backward`, sort paths based on dimensions categories from right to left.
stream
tickfont
transforms
uid
uirevision
Controls persistence of some user-driven changes to the trace: `constraintrange` in `parcoords` traces, as well as some `editable: true` modifications such as `name` and `colorbar.title`. Defaults to `layout.uirevision`. Note that other user-driven trace attribute changes are controlled by `layout` attributes: `trace.visible` is controlled by `layout.legend.uirevision`, `selectedpoints` is controlled by `layout.selectionrevision`, and `colorbar.(x|y)` (accessible with `config: {editable: true}`) is controlled by `layout.editrevision`. Trace changes are tracked by `uid`, which only falls back on trace index if no `uid` is provided. So if your app can add/remove traces before the end of the `data` array, such that the same trace has a different index, you can still preserve user-driven changes if you give each trace a `uid` that stays with it as it moves.
visible
Determines whether or not this trace is visible. If *legendonly*, the trace is not drawn, but can appear as a legend item (provided that the legend itself is visible).
AUTHOR
Pablo Rodríguez González <pablo.rodriguez.gonzalez@gmail.com>
COPYRIGHT AND LICENSE
This software is Copyright (c) 2018 by Pablo Rodríguez González.
This is free software, licensed under:
The MIT (X11) License