NAME
App::GUI::Juliagraph - drawing Mandelbrot and Julia fractals
SYNOPSIS
read this POD
start the program (juliagraph)
move knobs and observe how preview sketch reacts til you got an interesting image
push "Draw" (below drawing board or Ctrl+D) to produce full resolution image
choose "Save" in Image menu (or Ctrl+S) to store image in a PNG / JPEG / SVG file
choose "Write" in settings menu (Ctrl+W) to save settings into an INI file for tweaking them later
After first use of the program, a config file ~/.config/juliagraph will be created in you home directory. It contains mainly stored colors, color sets and dirs where to load and store setting files. You may also change it manually or deleted it to reset defaults.
DESCRIPTION
Mandelbrot (first thee) and Julia fractals (second three following) are just mathematical diagrams, showing you how iterating the equation z_n+1 = z_n ** 2 + C behaves in the complex plane. The pixel coordinates are taken as input and the count of iterations it took to exceed the stop/breakout value decide which color this point will painted in. In Mandelbrot fraktals the coordinates will be put into the variable C and in Julia fraktals into the variable z_0 (initial values of the iterator variable).

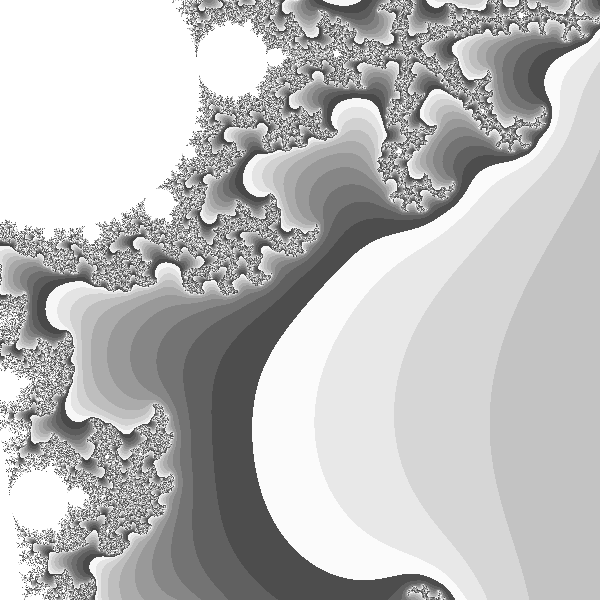
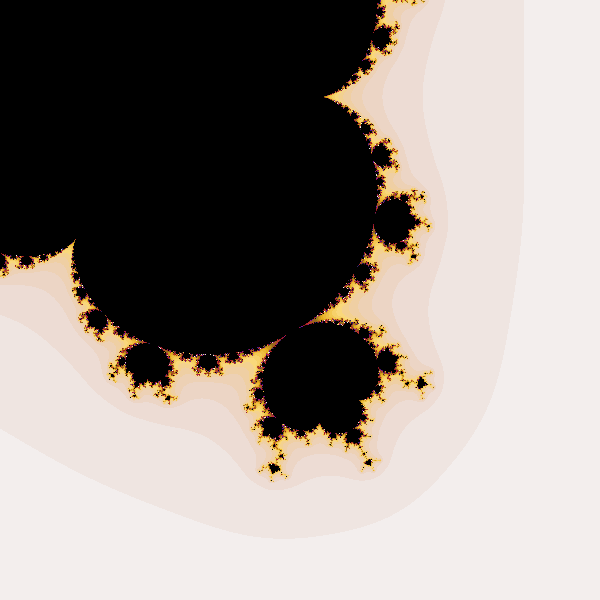
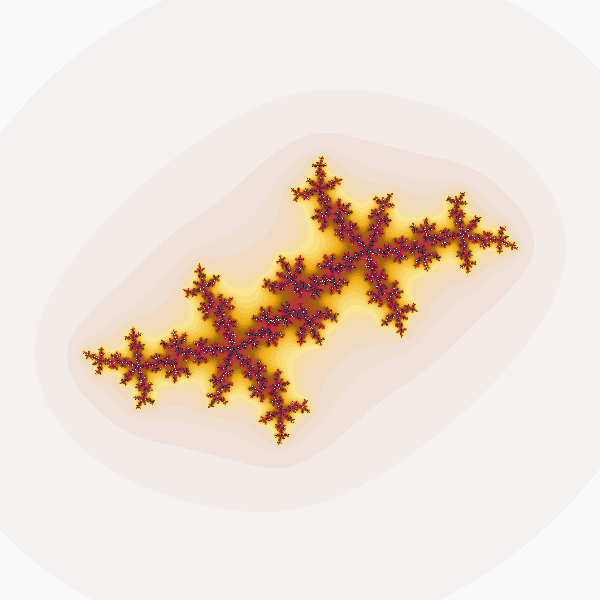
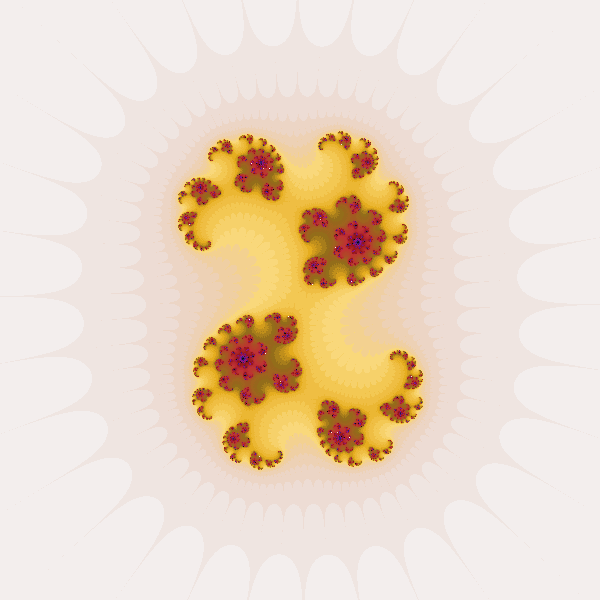
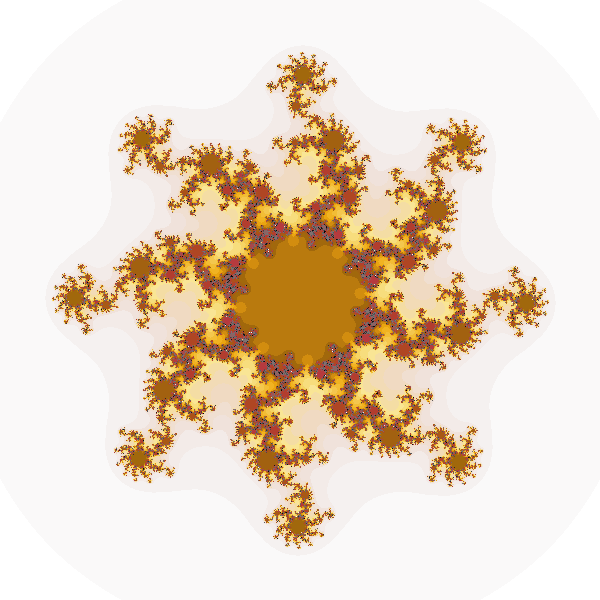
This program has additional capabilities/options:
choosable exponent above z_n
a linear part of the term making the formula into:
z_n+1 = z_n ** EXP + L * z_n + Cchoosable stop value and stop metric
free selection of colors
many option to map th colors onto iteration result values
GUI
The general layout is very simple: the settings (which define the fractal) are on the right and the drawing board is left. The settings are devided into several thematic tabs.
Please mind the tool tips - short help texts which appear if the mouse stands still over a button. Also helpful are messages in the status bar at the bottom that appear while browsing the menu.
Form
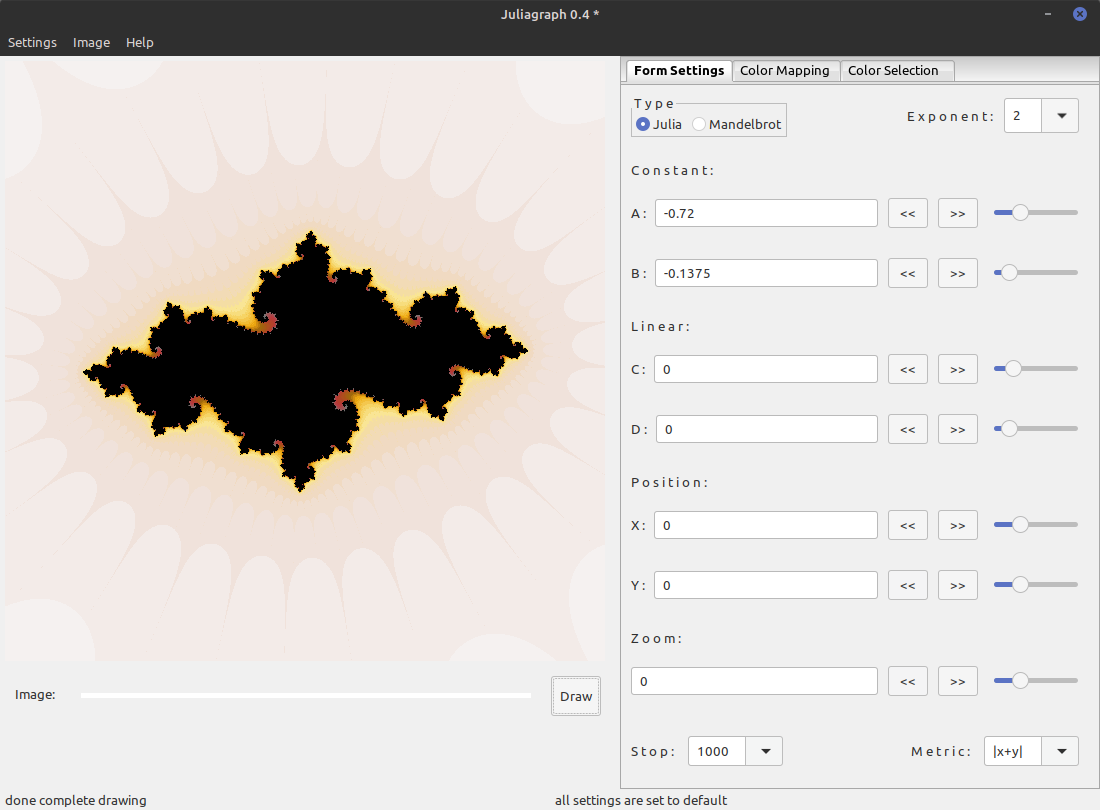
The content of the first tab are the settings that define the shape of the fractal. It also allows you to scroll and zoom into your region of interest.
This page contains 7 complex widgets, which need a little more explanation. They stretch over a row and have three parts. The leftmost part is a text field which you could change directly. In cases when pasting or typing special values into it they may be used, but in most other cases it is more convenient to use the other parts, since every value change will triger a new sketch drawing, which is not always fast. On the rightmost is a slider, which allows you to dial in a value. This value will be added or subtracted from the value in the textbox if you push the buttons in the middle part.
The first row on this page has two widgets. The first is a radiobox that lets you choose between Julia and Mandelbrot fraktals. The other is a combobox that lets you set the exponent in the iteration formula (see "DESCRIPTION"). These are the settings that change the shape most fundamentally.
Next are the inputs for the values A and B these are the real and imaginary parts of a complex constant. In a Julia fraktal this constant is added after each iteration. In the Mandelbrot fractal it will provide the starting value of Z.
Below that are the values C and D, which are real and imaginary parts of a factor. During each iteration the product of this factor with the iterator variable z will be added like the constant.
Below further are the X and Y coordinates of the center of the image. Changing these will move the visible part of the fractal left/right or down/up. Please note that these values are relative and if you zoom in, they will be become smaller.
The second lowest input is the zoom factor. It is greater the more you zoom in.
The lowest row contains two choices. First the stop value. If the iteration variable has a greater value than it - the iteration stops. Because we compare an complex iteration value with a real number, we compute the absolute value of the iteration variable (displayed by |var|). But other metrics are possible. Just keep in mind x is the real part of the iteration variable Z and y is the imaginary part.
Color Mapping
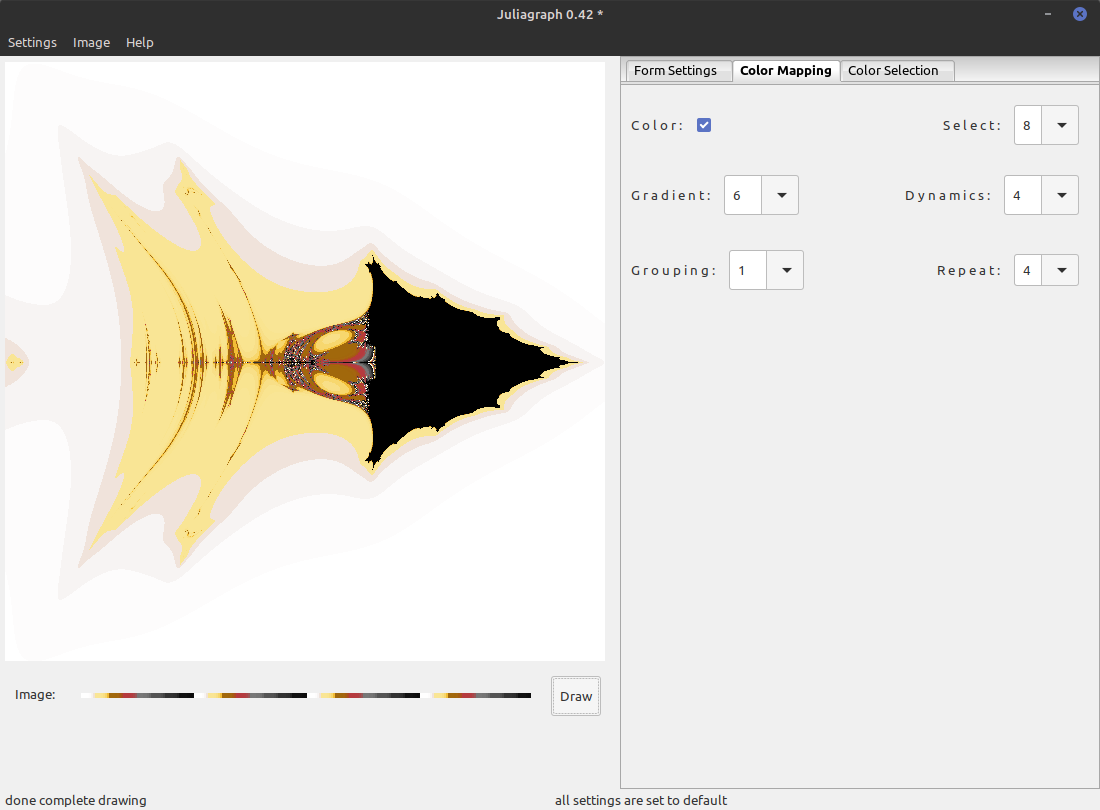
On the second tab we have three rows of settings which determine how the selected colors will be applied.
The first checkbox selects if we use the colors at all or just the default grey gradient. The combobox in the first row let you pick how many of the selected colors will be used. If you choose for instance 6, the first six (1..6) are used to display the fraktal, plus of course black as the background color for the area where the iteration variable never reaches the stop value. Never in this context mean the maximum available amunt of iterations as computed by the product of the numbers shown on this page except Dynamics.
The second row defines how we proceed from one color to the next. If for instance Gradient set to 5, there will be 5 additional colors between each of the selected colors, to make the transition smoother. If Dynamics is set to 0, this transition will be linear. Otherwise it will tilt into one or the other side.
The third row has two more settings which will influence the shape of these gradients. By setting the Grouping value higher than 1 you stretch the gradient by a factor. If for instance Grouping is set to three, three neighbouring areas which normally would have three different colors will have the same color and just the next, forth area will contain the next color. The Repeat value also multiplies the number of used colors. As soon the painter runs out of colors it will take the first again and repeat this process the ordered amount of times.
Colors
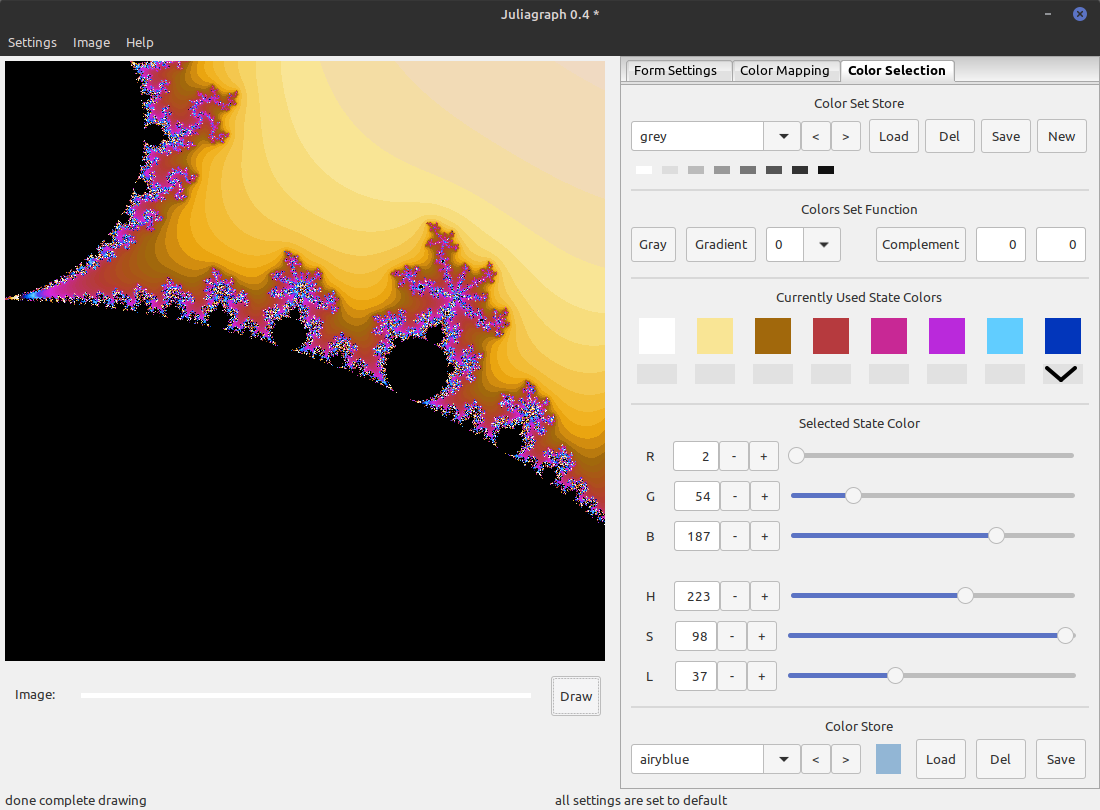
This page helps you to select the color that will be used to paint the fractal. Only the background color is currently fixed to black. You can see these colors in the middle section named "Currently Used State Colors". If you click on one - it will be selected which you can see from_rgbthe arrow below the selected color.
In the section below named "Selected State Color" you see the values in RGB space and HSL space of the selected color. Yan change any of them directly by slider, typing them in or pressing the plus and minus buttons.
The "Color Store" in the last row allows you store the selected color for later reuse (just press save and type in its name). With the combo box or the arrow buttons you can also select there a color and press load to chhose it as the new currently selected color. Press there Del(ete) to delete the visible color from the store.
Analogues to that there is a color set store in the first row of this page which enables you to store and load all currently used colors at once. Please use there the New button to create a new color set to avoid overwriting the currently seleced color set, when pressing Save.
The second row contains some color set functions to create gradients between the leftmost and selected color or to compute colors that are complementary to the selected.
Menu
The upmost menu bar has only three very simple menus. Please not that each menu shows which key combination triggers the same command and while hovering over an menu item you see a short help text the left status bar field.
The first menu is for loading and storing setting files with arbitrary names. Also a sub menu allows a quick load of the recently used files. The first entry lets you reset the whole program to the starting state and the last is just to exit (safely with saving the configs).
The second menu has only two commands for drawing an complete image and saving it in an arbitrary named PNG, JPG or SVG file (the file ending decides). The submenu above onle set the preferred format, which is the format of serial images and the first wild card in dialog. Above that is another submenu for setting the image size.
The third menu has only a dialog with some additional information of version numbers and our homepage.
SEE ALSO
AUTHOR
Herbert Breunung (lichtkind@cpan.org)
COPYRIGHT
Copyright(c) 2023 by Herbert Breunung
All rights reserved. This program is free software and can be used and distributed under the GPL 3 licence.