NAME
IUP::PPlot - [GUI element] canvas-like element for creating 2D plots
DESCRIPTION
Creates a PPlot-based plot. PPlot is a library for creating plots that is system independent.
It is available at SourceForge http://pplot.sourceforge.net. However the standard PPlot distribution source code was changed for iup_pplot library (to improve features and visual appearance).
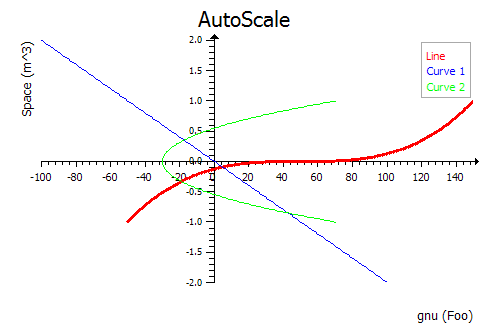 |
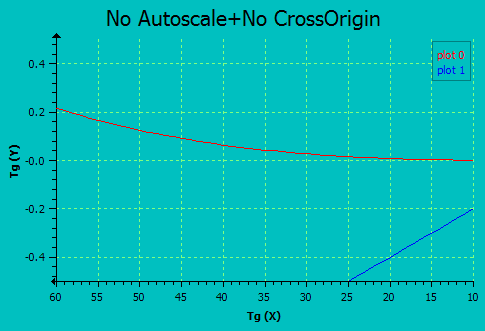 |
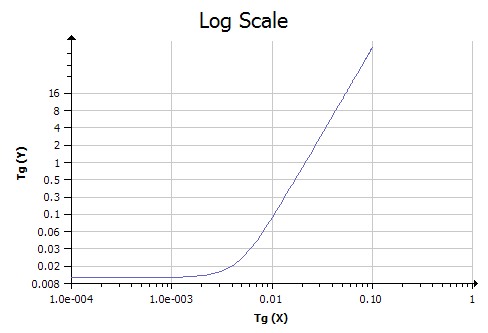 |
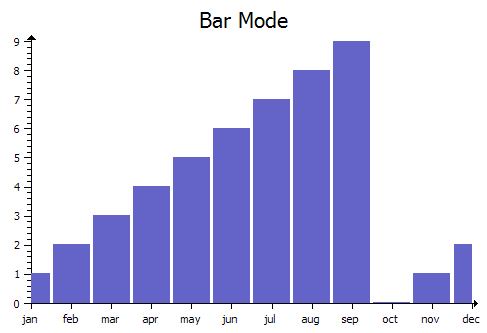 |
 |
 |
USAGE
CREATION - new() method
$pplot = IUP::PPlot->new( TITLE=>"Simple Data", GRID=>"YES" );Returns: the identifier of the created element, or undef if an error occurs.
NOTE: You can pass to new() other ATTRIBUTE=>'value' or CALLBACKNAME=>\&func pairs relevant to this element - see IUP::Manual::02_Elements.
Guide
Each plot can contain 2 axis (X and Y), a title, a legend box, a grid, a dataset area and as many datasets you want.
Each data set is added using the IUP::PPlotAdd function. All other plot parameters are configured by attributes.
If no attribute is set, the default values were selected to best display the plot.
When setting attributes the plot is NOT redrawn until the REDRAW attribute is set or a redraw event occurs.
The dataset area is delimited by a margin. Data is only plotted inside the dataset area. Axis and main title are positioned independent of this margin. It is very important to set the margins when using axis automatic scaling or the axis maybe hidden.
The legend box is a list of the dataset names, each one drawn with the same color of the correspondent dataset. The box is located in one of the four corners of the dataset area.
The grid is automatically spaced accordingly the current axis displayed values.
The title is always centered in the top of the plot.
The axis are always positioned at the origin, except when CrossOrigin is disabled, then it is positioned at the left-bottom. If values are only positive then the origin will be placed in left bottom position. If values are negative and positive then origin will be placed inside the plot. The ticks in the axis are also automatically distributed.
PPlot implementation demands that the MARGIN* attributes must be set so the plot is not cropped.
Interaction
Zoom
Zoom in can be done selecting a region using the left mouse button. Zoom out is done with a single click of the left mouse button. If the Ctrl+X key combination is pressed the zoom selection is restricted to the X axis, the Y axis will be left unchanged. If the Ctrl+Y key combination is pressed the zoom selection is restricted to the Y axis, the X axis will be left unchanged. If the Ctrl+R key combination is pressed the zoom selection is restored to a free rectangle.
Each zoom in operation is stacked, so each zoom out operation goes back the the previous zoom selection.
Zoom operates on AXS_XMAX, AXS_XMIN, AXS_YMAX, AXS_YMIN even if AUTOMIN/MAX is enabled. The axis may be hidden depending on the selected rectangle.
CrossHair Cursor
If you press the Ctrl+Shift key combination, while holding the left mouse button down, a cross hair cursor will be displayed for each dataset in the plot. The X coordinate will control the cursor, the Y coordinate will reflect each dataset correspondent value.
Selection and Editing
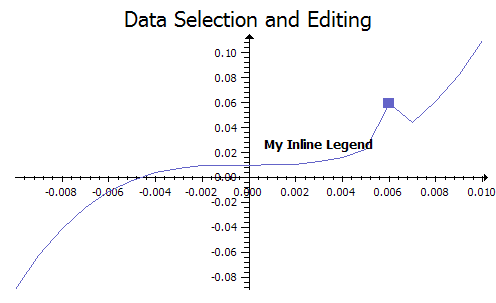
Selection and editing of a dataset can be enabled using the DS_EDIT attribute.
To select all the samples in the dataset press the Shift key while clicking with the left mouse button near a sample in the dataset. To deselect all samples press the Shift key while clicking with the left mouse button in the background.
To select or deselect individual samples press the Ctrl key while clicking with the left mouse button near the sample in the dataset.
After selecting samples use the Del key to remove the selected samples. Also use the arrow keys to move the Y coordinate of the selected samples. Press the Ctrl key to increase the step size when moving the Y coordinate.
Auxiliary Functions
PlotBegin()
$plot->PlotBegin($dim);
# $dim = 1 (for 1D) or 2 (for 2D)
Prepares a dataset to receive samples. The dimension of the data can be 1, 2 or 3.
PlotEnd()
$index = $plot->PlotEnd();Adds a 2D dataset to the plot and returns the dataset index. The data set can be empty. Redraw is NOT done until the REDRAW attribute is set. Also it will change the current dataset index to the return value. You can only set attributes of a dataset AFTER you added the dataset. Can only be called if PlotBegin was called. Whenever you create a dataset all its "DS_*" attributes will be set to the default values. Notice that DS_MODE must be set before other "DS_*" attributes.
PlotNewDataSet()
$plot->PlotNewDataSet($dim);
# $dim = 1 (for 1D) or 2 (for 2D)
Creates an empty dataset to receive samples. The dimension of the data can be 1 or 2.
PlotAdd1D()
$plot->PlotAdd1D($name, $y);
#or
$plot->PlotAdd1D(\@name, \@y);
#or
$plot->PlotAdd1D($y);
#or
$plot->PlotAdd1D(\@y);
Adds a sample to the dataset. Can only be called if PlotBegin was called with dim=1. name is an optional string used for tick labels in the X axis, and it can be undef. Names are allowed only for the first dataset and when set ticks configuration for the X axis is ignored, all the names are shown.
PlotAdd2D()
$plot->PlotAdd2D($x, $y);
#or
$plot->PlotAdd2D(\@x, \@y);
PlotInsert1D()
$plot->PlotInsert1D($index, $sample_index, \@name, \@y);
#or
$plot->PlotInsert1D($index, $sample_index, \@y);
See PlotInsert2D.
PlotInsert2D()
$plot->PlotInsert2D($index, $sample_index, \@x, \@y);Inserts an array of samples in the dataset ds_index at the given sample_index. Can be used only after the dataset is added to the plot (after PlotBegin). sample_index can be after the last sample so data is appended to the array. Current data is shifted if necessary.
PlotTransform()
($ix, $iy) = $plot->PlotTransform($x, $y);Converts coordinates in plot units to pixels. It should be used in PREDRAW_CB and POSTDRAW_CB callbacks only. Output variables can be undef if not used. It can be used inside other callbacks, but make sure that the drawing after a resize is done.
PlotPaintTo()
$plot->PlotPaintTo($canvas);Plots to the given canvas instead of the display canvas.
Handy if you want to save the plot into IUP::Canvas::SVG or IUP::Canvas::EMF like this:
my $cnv = IUP::Canvas::SVG->new(filename=>"output.svg", width=>300, height=>210, resolution=>4);
$mainplot->PlotPaintTo($cnv);
$cnv->cdKillCanvas();
ATTRIBUTES
For more info about concept of attributes (setting/getting values etc.) see IUP::Manual::03_Attributes. Attributes specific to this element:
Basic
- REDRAW
-
(write-only, non inheritable) Redraw the plot and update the display. Value is ignored. All other attributes will NOT update the display, so you can set many attributes without visual output.
- USE_IMAGERGB
-
(non inheritable) Defines if the double buffer will use standard driver image (NO - faster) or an RGB image (YES - slower). Default: NO. The IMAGERGB driver has anti-aliasing which can improve the line drawing.
- USE_GDI+
-
[Windows Only] (non inheritable) Defines if the double buffer will use GDI+ (YES) for drawing or standard GDI (NO). Default: NO. The GDI+ driver has anti-aliasing which can improve the line drawing.
- FONT
-
The font used in all text elements of the plot: title, legend and labels.
- BGCOLOR
-
The background color. The default value is white "255 255 255".
- FGCOLOR
-
The title color. The default value is black "0 0 0".
- TITLE
-
(non inheritable) The title. Located always at the top center area.
- TITLEFONTSIZE, TITLEFONTSTYLE
-
(non inheritable) The title font size and style. The default values depends on the FONT attribute and the returned value is
undef. Set toundef, to use the FONT attribute values. Style can be "PLAIN", "BOLD", "ITALIC" or "BOLDITALIC". - MARGINLEFT, MARGINRIGHT, MARGINTOP, MARGINBOTTOM
-
(non inheritable) Margin of the dataset area. PPlot implementation demands that margins must be set so the plot is not cropped. Default: "15", "15", "30", "15".
Legend Configuration (non inheritable)
- LEGENDSHOW
-
Shows or hides the legend box. Can be YES or NO. Default: NO.
- LEGENDPOS
-
Legend box position. Can be: "TOPLEFT", "TOPRIGHT", "BOTTOMLEFT", or "BOTTOMRIGHT. Default: "TOPRIGHT".
- LEGENDFONTSIZE, LEGENDFONTSTYLE
-
The legend box text font size and style.
Grid Configuration (non inheritable)
- GRIDLINESTYLE
-
Line style of the grid. Can be: "CONTINUOUS", "DASHED", "DOTTED", "DASH_DOT", "DASH_DOT_DOT". Default is "CONTINUOUS".
- GRIDCOLOR
-
Grid color. Default: "200 200 200".
- GRID
-
Shows or hides the grid in both or a specific axis. Can be: YES (both), HORIZONTAL, VERTICAL or NO. Default: NO.
Dataset Management (non inheritable)
- REMOVE
-
(write-only) Removes a dataset given its index.
- CLEAR
-
(write-only) Removes all datasets. Value is ignored.
- COUNT
-
[read-only] Total number of datasets.
- CURRENT
-
Current dataset index. Default is -1. When a dataset is added it becomes the current dataset. The index starts at 0. All "DS_*" attributes are dependent on this value.
- DS_LEGEND
-
Legend text of the current dataset. Default is dynamically generated: "plot 0", "plot 1", "plot 2", ...
- DS_COLOR
-
Color of the current dataset and it legend text. Default is dynamically generated for the 6 first datasets, others are default to black "0 0 0". The first 6 are: 0="255 0 0", 1="0 0 255", 2="0 255 0", 3="0 255 255", 4="255 0 255", 5="255 255 0".
- DS_MODE
-
Drawing mode of the current dataset. Can be: "LINE", "BAR", "MARK" or "MARKLINE". Default: "LINE". This must be set before other "DS_*" attributes.
- DS_LINESTYLE
-
Line style of the current dataset. Can be: "CONTINUOUS", "DASHED", "DOTTED", "DASH_DOT", "DASH_DOT_DOT". Default is "CONTINUOUS".
- DS_LINEWIDTH
-
Line width of the current dataset. Default: 1.
- DS_MARKSTYLE
-
Mark style of the current dataset. Can be: "PLUS", "STAR", "CIRCLE", "X", "BOX", "DIAMOND", "HOLLOW_CIRCLE", "HOLLOW_BOX", "HOLLOW_DIAMOND". Default is "X".
- DS_MARKSIZE
-
Mark size of the current dataset. Default: 7.
- DS_SHOWVALUES
-
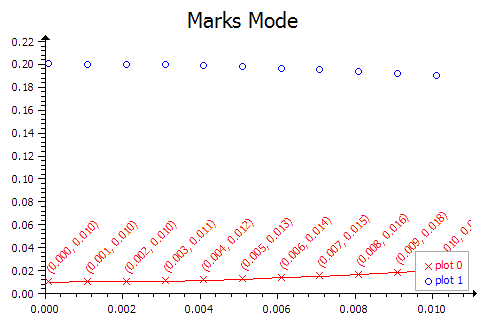
Enable or disable the display of the values near each sample. Can be YES or NO. Default: NO.
- DS_REMOVE
-
(write-only) Removes a sample from the current dataset given its index.
- DS_EDIT
-
Enable or disable the current dataset selection and editing. Can be YES or NO. Default: NO.
Axis Configuration (non inheritable)
- AXS_XCOLOR, AXS_YCOLOR
-
Axis, ticks and label color. Default: "0 0 0".
- AXS_XMAX, AXS_XMIN, AXS_YMAX, AXS_YMIN
-
Minimum and maximum displayed values of the respective axis. Automatically calculated values when AUTOMIN or AUTOMAX are enabled.
- AXS_XAUTOMIN, AXS_XAUTOMAX, AXS_YAUTOMIN, AXS_YAUTOMAX
-
Configures the automatic scaling of the minimum and maximum display values. Can be YES or NO. Default: YES.
- AXS_XLABEL, AXS_YLABEL
-
Text label of the respective axis.
- AXS_XLABELCENTERED, AXS_YLABELCENTERED
-
Text label position at center (YES) or at top/right (NO). Default: YES.
- AXS_XREVERSE, AXS_YREVERSE
-
Reverse the axis direction. Can be YES or NO. Default: NO. Default is Y oriented bottom to top, and X oriented from left to right.
- AXS_XCROSSORIGIN, AXS_YCROSSORIGIN
-
Allow the axis to cross the origin and to be placed inside the dataset area. Can be YES or NO. Default: YES.
- AXS_XSCALE, AXS_YSCALE
-
Configures the scale of the respective axis. Can be: LIN (liner), LOG10 (base 10), LOG2 (base 2) and LOGN (base e). Default: LIN.
- AXS_XFONTSIZE, AXS_YFONTSIZE, AXS_XFONTSTYLE, AXS_YFONTSTYLE
-
Axis label text font size and style. See TITLEFONTSIZE and TITLEFONTSTYLE.
- AXS_XTICK, AXS_YTICK
-
Enable or disable the axis tick display. Can be YES or NO. Default: YES.
- AXS_XTICKFORMAT, AXS_YTICKFORMAT
-
Axis tick number C format string. Default: "%.0f".
- AXS_XTICKFONTSIZE, AXS_YTICKFONTSIZE, AXS_XTICKFONTSTYLE, AXS_YTICKFONTSTYLE
-
Axis tick number font size and style. See TITLEFONTSIZE and TITLEFONTSTYLE.
- AXS_XAUTOTICK, AXS_YAUTOTICK
-
Configures the automatic tick spacing. Can be YES or NO. Default: YES.
- AXS_XTICKMAJORSPAN, AXS_YTICKMAJORSPAN
-
The spacing between major ticks. Default is 1 when AUTOTICK is disabled.
- AXS_XTICKDIVISION, AXS_YTICKDIVISION
-
Number of ticks between each major tick. Default is 5 when AUTOTICK is disabled.
- AXS_XAUTOTICKSIZE, AXS_YAUTOTICKSIZE
-
Configures the automatic tick size. Can be YES or NO. Default: YES.
- AXS_XTICKSIZE, AXS_YTICKSIZE
-
Size of ticks in pixels. Default is 5 when AUTOTICKSIZE is disabled.
- AXS_XTICKMAJORSIZE, AXS_YTICKMAJORSIZE
-
Size of major ticks in pixels. Default is 8 when AUTOTICKSIZE is disabled.
The following common attributes are also accepted:
CALLBACKS
For more info about concept of callbacks (setting callback handlers etc.) see IUP::Manual::04_Callbacks. Callbacks specific to this element:
- DELETE_CB
-
Action generated when the Del key is pressed to removed a sample from a dataset. If multiple points are selected it is called once for each selected point.
Callback handler prototype:
sub delete_cb_handler {
  my ($self, $index, $sample_index, $x, $y) = @_;
  #...
}
$index: index of the dataset
$sample_index: index of the sample in the dataset
$x: X coordinate value of the sample
$y: Y coordinate value of the sample
Returns: If IUP_IGNORE then the sample is not deleted.
- DELETEBEGIN_CB, DELETEEND_CB
-
Actions generated when a delete operation will begin or end. But they are called only if DELETE_CB is also defined.
Callback handler prototype:
sub deletebegin_cb_handler {
  my ($self) = @_;
  #...
}
Callback handler prototype:
sub deleteend_cb_handler {
  my ($self) = @_;
  #...
}
Returns: If DELETEBEGIN_CB returns IUP_IGNORE the delete operation for all the selected samples are aborted.
- SELECT_CB
-
Action generated when a sample is selected. If multiple points are selected it is called once for each new selected point. It is called only if the selection state of the sample is about to be changed.
Callback handler prototype:
sub select_cb_handler {
  my ($self, $index, $sample_index, $x, $y, $select) = @_;
  #...
}
$index - index of the dataset
$sample_index - index of the sample in the dataset
$x: X coordinate value of the sample
$y: Y coordinate value of the sample
$select: boolean value that a non zero value indicates if the point is to be selected.
Returns: If IUP_IGNORE then the sample is not selected.
- SELECTBEGIN_CB, SELECTEND_CB
-
Actions generated when a selection operation will begin or end. But they are called only if SELECT_CB is also defined.
Callback handler prototype:
sub seletebegin_cb_handler {
  my ($self) = @_;
  #...
}
Callback handler prototype:
sub selectend_cb_handler {
  my ($self) = @_;
  #...
}
Returns: If SELECTBEGIN_CB returns IUP_IGNORE the selection operation is aborted.
- EDIT_CB
-
Action generated when a sample is selected. If multiple points are selected it is called once for each new selected point. It is called only if the selection state of the sample is about to be changed.
Callback handler prototype:
sub edit_cb_handler {
  my ($self, $index, $sample_index, $x, $y) = @_;
  my $new_x, $new_y, $retval;
  #...
  return ($new_x, $new_y, $retval);
}
#ZZZ-test-this
$index: index of the dataset
$sample_index: index of the sample in the dataset
$x: X coordinate value of the sample
$y: Y coordinate value of the sample
$new_x: (return value) the new X coordinate value of the sample
$new_y: (return value) the new Y coordinate value of the sample
$retval: (return value) If IUP_IGNORE then the sample is not edited. The application can changed the new value before it is edited.
- EDITBEGIN_CB, EDITEND_CB
-
Actions generated when an editing operation will begin or end. But they are called only if EDIT_CB is also defined.
Callback handler prototype:
sub editbegin_cb_handler {
  my ($self) = @_;
  #...
}
Callback handler prototype:
sub editend_cb_handler {
  my ($self) = @_;
  #...
}
Returns: If EDITBEGIN_CB returns IUP_IGNORE the editing operation is aborted.
- PREDRAW_CB, POSTDRAW_CB
-
Actions generated before and after the redraw operation. Predraw can be used to draw a different background and Postdraw can be used to draw additional information in the plot. Predraw has no restrictions, but Postdraw is clipped to the dataset area. To position elements in plot units, use the PlotTransform function.
Callback handler prototype:
sub predraw_cb_handler {
  my ($self, $canvas) = @_;
  #...
}
Callback handler prototype:
sub postdraw_cb_handler {
  my ($self, $canvas) = @_;
  #...
}
$cnv: reference to IUP::Canvas where the draw operation occurs.
The following common callbacks are also accepted:
EXAMPLES
The element IUP::PPlot is used in the following sample scripts:
0-basic/plot1.pl - IUP::PPlot example
0-basic/plot2.pl - IUP::PPlot example
0-basic/plot3.pl - IUP::PPlot example
0-basic/plot4.pl - IUP::PPlot example
0-basic/plot5.pl - IUP::PPlot example
0-basic/plot_advanced.pl - Plot controls
1-apps/app-plot-demo.pl - dials for zooming
SEE ALSO
The original doc: iup_pplot.html