NAME
Pie - A writer class for Excel Pie charts.
SYNOPSIS
To create a simple Excel file with a Pie chart using Spreadsheet::WriteExcel:
#!/usr/bin/perl -w

use strict;
use Spreadsheet::WriteExcel;

my $workbook  = Spreadsheet::WriteExcel->new( 'chart.xls' );
my $worksheet = $workbook->add_worksheet();

my $chart     = $workbook->add_chart( type => 'pie' );

# Configure the chart.
$chart->add_series(
    categories => '=Sheet1!$A$2:$A$7',
    values     => '=Sheet1!$B$2:$B$7',
);

# Add the worksheet data the chart refers to.
my $data = [
    [ 'Category', 2, 3, 4, 5, 6, 7 ],
    [ 'Value',    1, 4, 5, 2, 1, 5 ],
];

$worksheet->write( 'A1', $data );

__END__
DESCRIPTION
This module implements Pie charts for Spreadsheet::WriteExcel. The chart object is created via the Workbook add_chart() method:
my $chart = $workbook->add_chart( type => 'pie' );Once the object is created it can be configured via the following methods that are common to all chart classes:
$chart->add_series();
$chart->set_title();
These methods are explained in detail in Spreadsheet::WriteExcel::Chart. Class specific methods or settings, if any, are explained below.
Pie Chart Methods
There aren't currently any pie chart specific methods. See the TODO section of Spreadsheet::WriteExcel::Chart.
A Pie chart doesn't have an X or Y axis so the following common chart methods are ignored.
$chart->set_x_axis();
$chart->set_y_axis();
EXAMPLE
Here is a complete example that demonstrates most of the available features when creating a chart.
#!/usr/bin/perl -w
use strict;
use Spreadsheet::WriteExcel;
my $workbook = Spreadsheet::WriteExcel->new( 'chart_pie.xls' );
my $worksheet = $workbook->add_worksheet();
my $bold = $workbook->add_format( bold => 1 );
# Add the worksheet data that the charts will refer to.
my $headings = [ 'Category', 'Values' ];
my $data = [
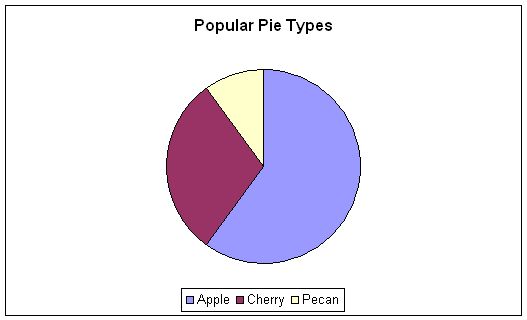
[ 'Apple', 'Cherry', 'Pecan' ],
[ 60, 30, 10 ],
];
$worksheet->write( 'A1', $headings, $bold );
$worksheet->write( 'A2', $data );
# Create a new chart object. In this case an embedded chart.
my $chart = $workbook->add_chart( type => 'pie', embedded => 1 );
# Configure the series.
$chart->add_series(
name => 'Pie sales data',
categories => '=Sheet1!$A$2:$A$4',
values => '=Sheet1!$B$2:$B$4',
);
# Add a title.
$chart->set_title( name => 'Popular Pie Types' );
# Insert the chart into the worksheet (with an offset).
$worksheet->insert_chart( 'C2', $chart, 25, 10 );
__END__This will produce a chart that looks like this:
AUTHOR
John McNamara jmcnamara@cpan.org
COPYRIGHT
Copyright MM-MMX, John McNamara.
All Rights Reserved. This module is free software. It may be used, redistributed and/or modified under the same terms as Perl itself.